SDSC Expanse cluster live AI/ML metrics
The Expanse cluster at the San Diego Supercomputer Center is a batch-oriented science computing gateway serving thousands of users and a wide range of research projects, see Google News for examples.
The SDSC Expanse cluster live AI/ML metrics dashboard displays real-time metrics for workloads running on the cluster:
- Total Traffic Total traffic entering fabric
- Cluster Services Traffic associated with orchestration (Slurm) and storage (Lustre, Ceph and NFS)
- Core Link Traffic Histogram of load on fabric links
- Edge Link Traffic Histogram of load on access ports
- RDMA Operations Total RDMA operations
- RDMA Avg. Bytes per Operation Average RDMA operation size
- Infiniband Operations Total RoCEv2 Infiniband operations broken out by type
- Compute / Exchange Interval Detected period of compute / exchange activity on fabric
- Congestion Notification Messages Total ECN / CNP congestion messages
- Infiniband Ack. Credits Average number of credits in RoCEv2 Infiniband acknowledgements
- Packet Discards Total ingress / egress discards
- Packet Errors Total ingress / egress errors
Launch the dashboard and explore the data:
- Time Interval Change the time interval, using the widget at the top right of the dashboard, to see trends over the last 30 days or per second detail in the last 5 minutes
- Zoom In If you see any interesting peaks in one of the charts, drag to select a time interval and zoom in to see the details
- Select Metrics Click on items in chart legends to display selected metrics
Expanse offers an interesting variety of network traffic patterns as each scheduled task makes use of a different set of cluster resources.
How-to guide
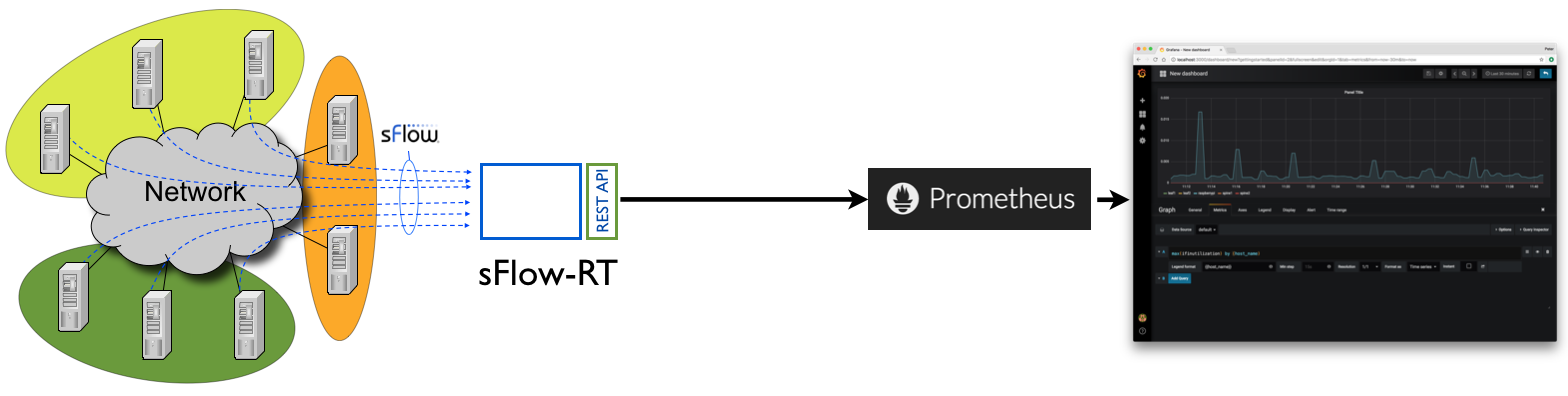
All switches in the Expanse cluster leaf and spine fabric stream industry standard sFlow telemetry to an instance of the sFlow-RT real-time analytics engine. A Prometheus time series database stores metrics every second and a Grafana dashboard displays cluster metrics.
Follow instructions in AI Metrics with Prometheus and Grafana