Getting Started
Try out sFlow-RT's real-time analytics by following the steps in this guide.
Step 1: Install sFlow-RT
Follow the download and installation instructions for your platform.
Step 2: Install applications
Start off by installing the browse-metrics and browse-flows applications:
sudo /usr/local/sflow-rt/get-app.sh sflow-rt browse-metrics
sudo /usr/local/sflow-rt/get-app.sh sflow-rt browse-flows
Restart sFlow-RT to load the applications:
sudo systemctl restart sflow-rtNote: If you are using Docker, the sflow/prometheus image includes these applications.
Step 3: Access user interface
The user interface can be accessed using a web browser. Connect to HTTP port 8008 on the host running sFlow-RT, for example http://localhost:8008 if you are running the software on your laptop/desktop.
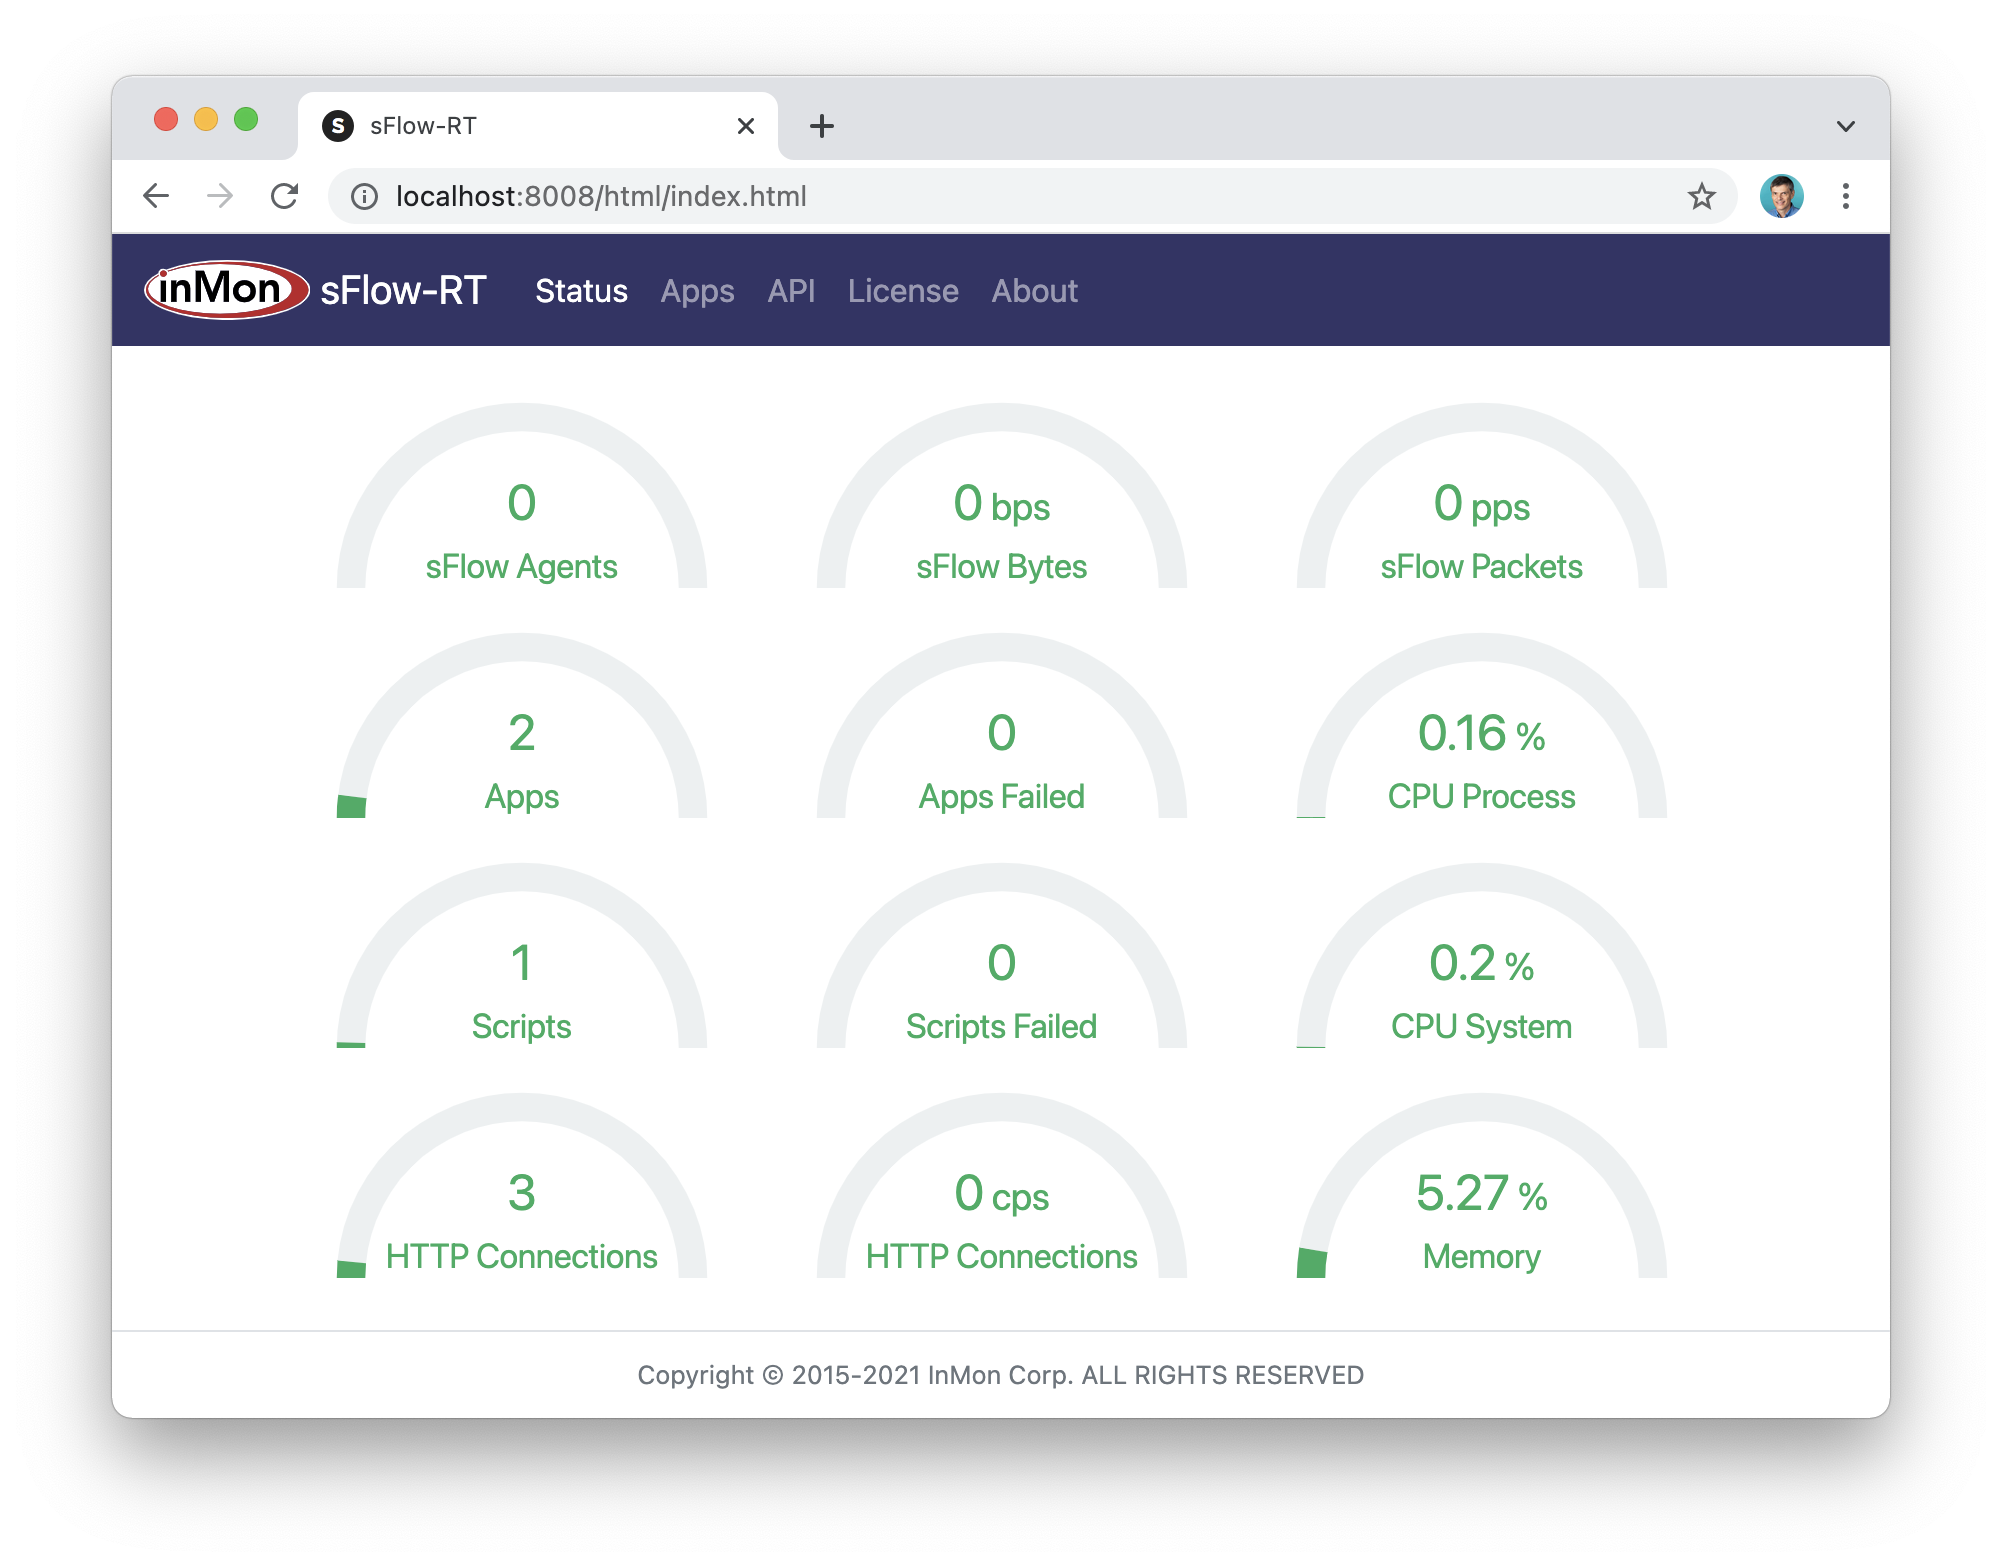
The sFlow-RT Status page shows key metrics about the health and performance of sFlow-RT.
Step 4: Configure / deploy agents
Agents describes how to configure sFlow in existing network devices and/or deploy agents to monitor hosts, hypervisors, containers, Swarm and Kubernetes clusters. Use the sFlow-RT Status page to verify that sFlow telemetry is being received - the sFlow Agents, sFlow Bytes and sFlow Packets gauges should all have non-zero values.
Note: If sFlow is not being received, check the device configurations and ensure that any firewalls between the agents and the sFlow-RT host allow UDP port 6343 packets pass to the sFlow-RT host, see Download and Install.
If you don't have immediate access to a network, Real-time network and system metrics as a service describes how to replay captured sFlow data to explore the capabilities of the software on your laptop. Alternatively, sflow-rt/containerlab includes projects that emulate leaf and spine networks, EVPN, and DDoS mitigation, that can be run on a laptop using Docker Desktop.
Step 5: Explore data
Access the sFlow-RT user interface.
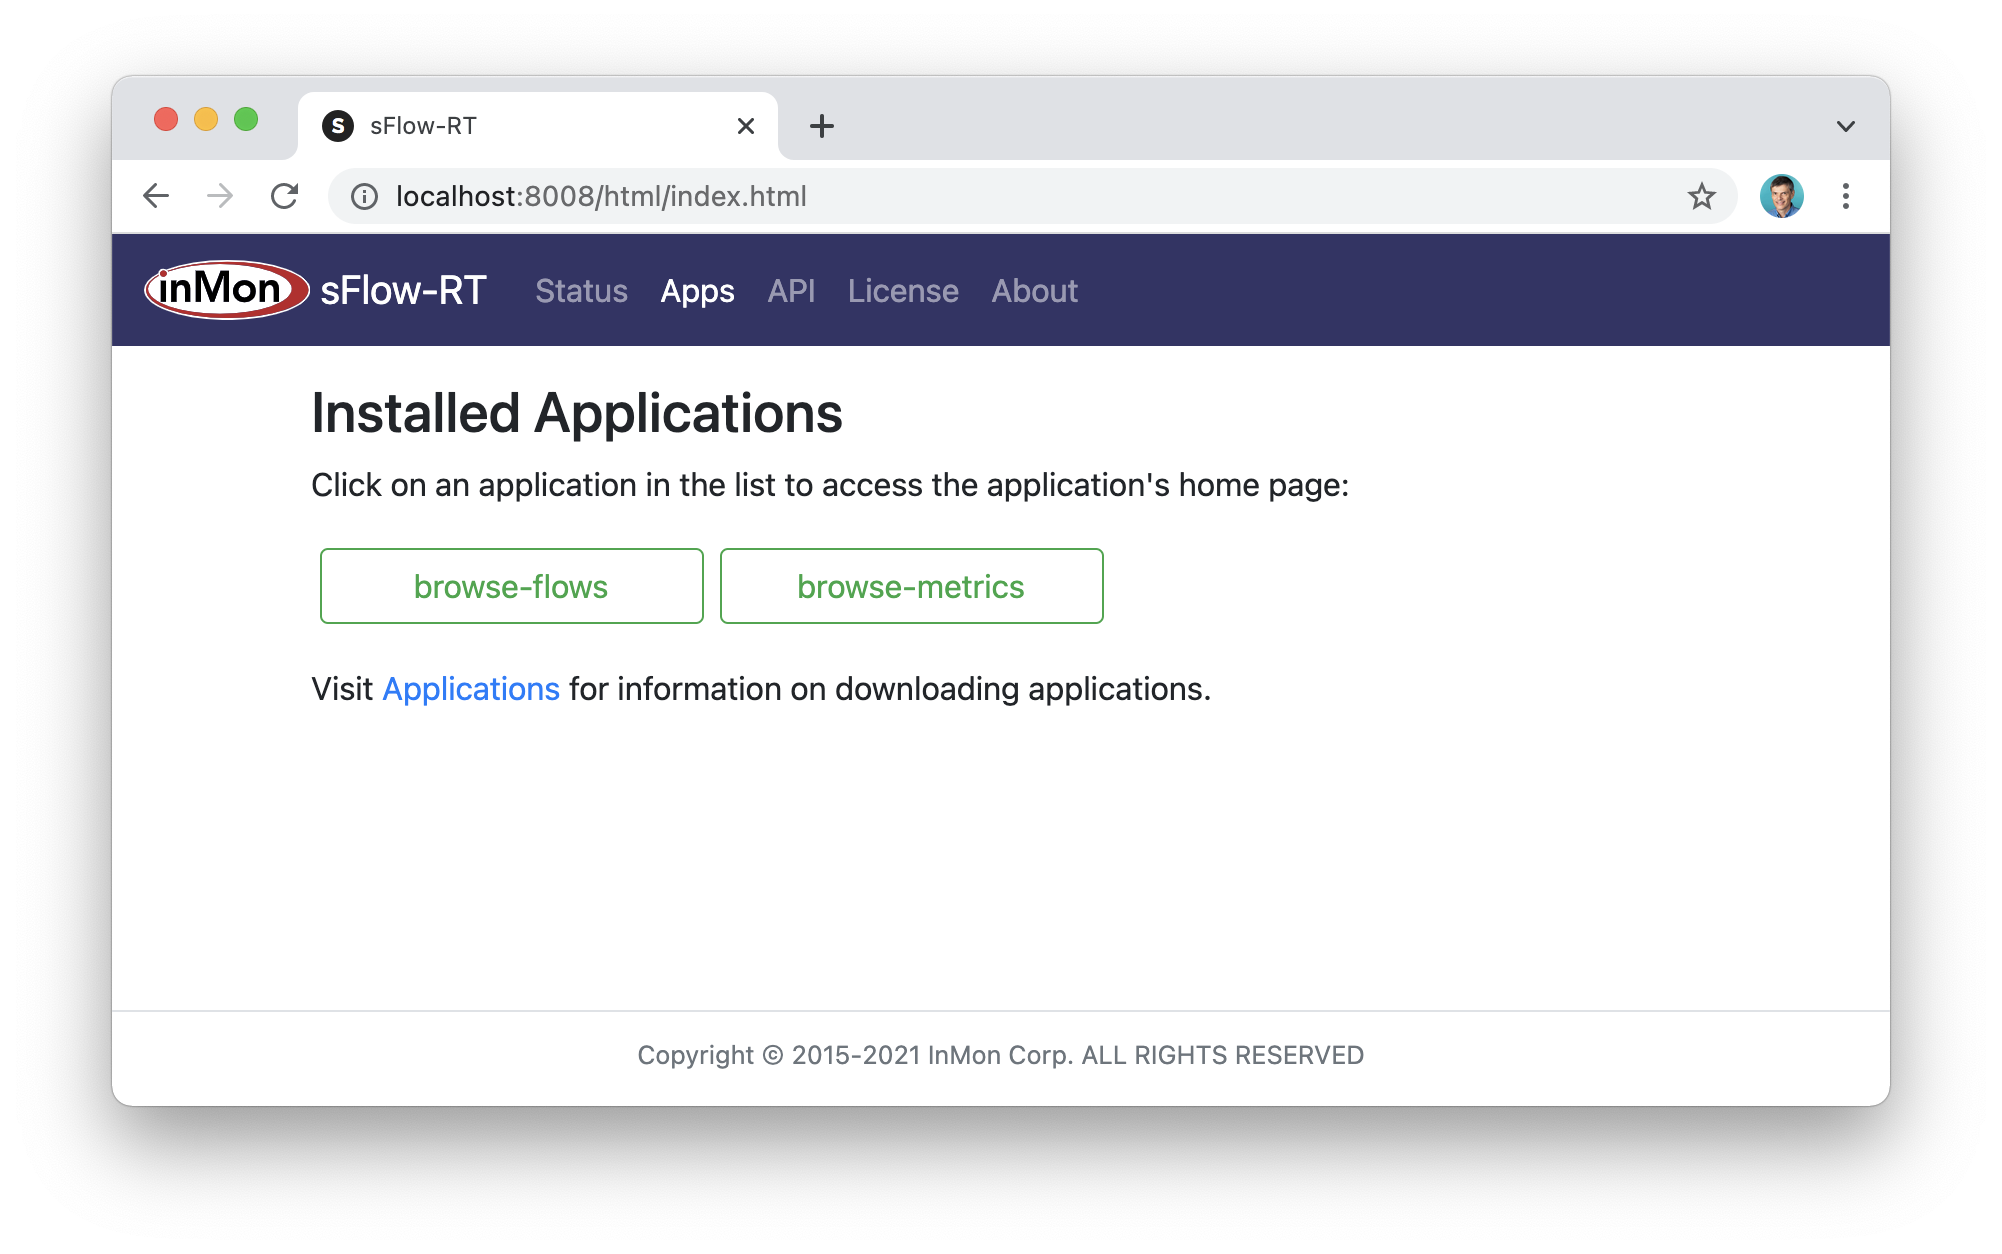
The Apps tab lists the two applications we installed, browse-flows and browse-metrics, and the green color of the buttons indicates both applications are healthy.
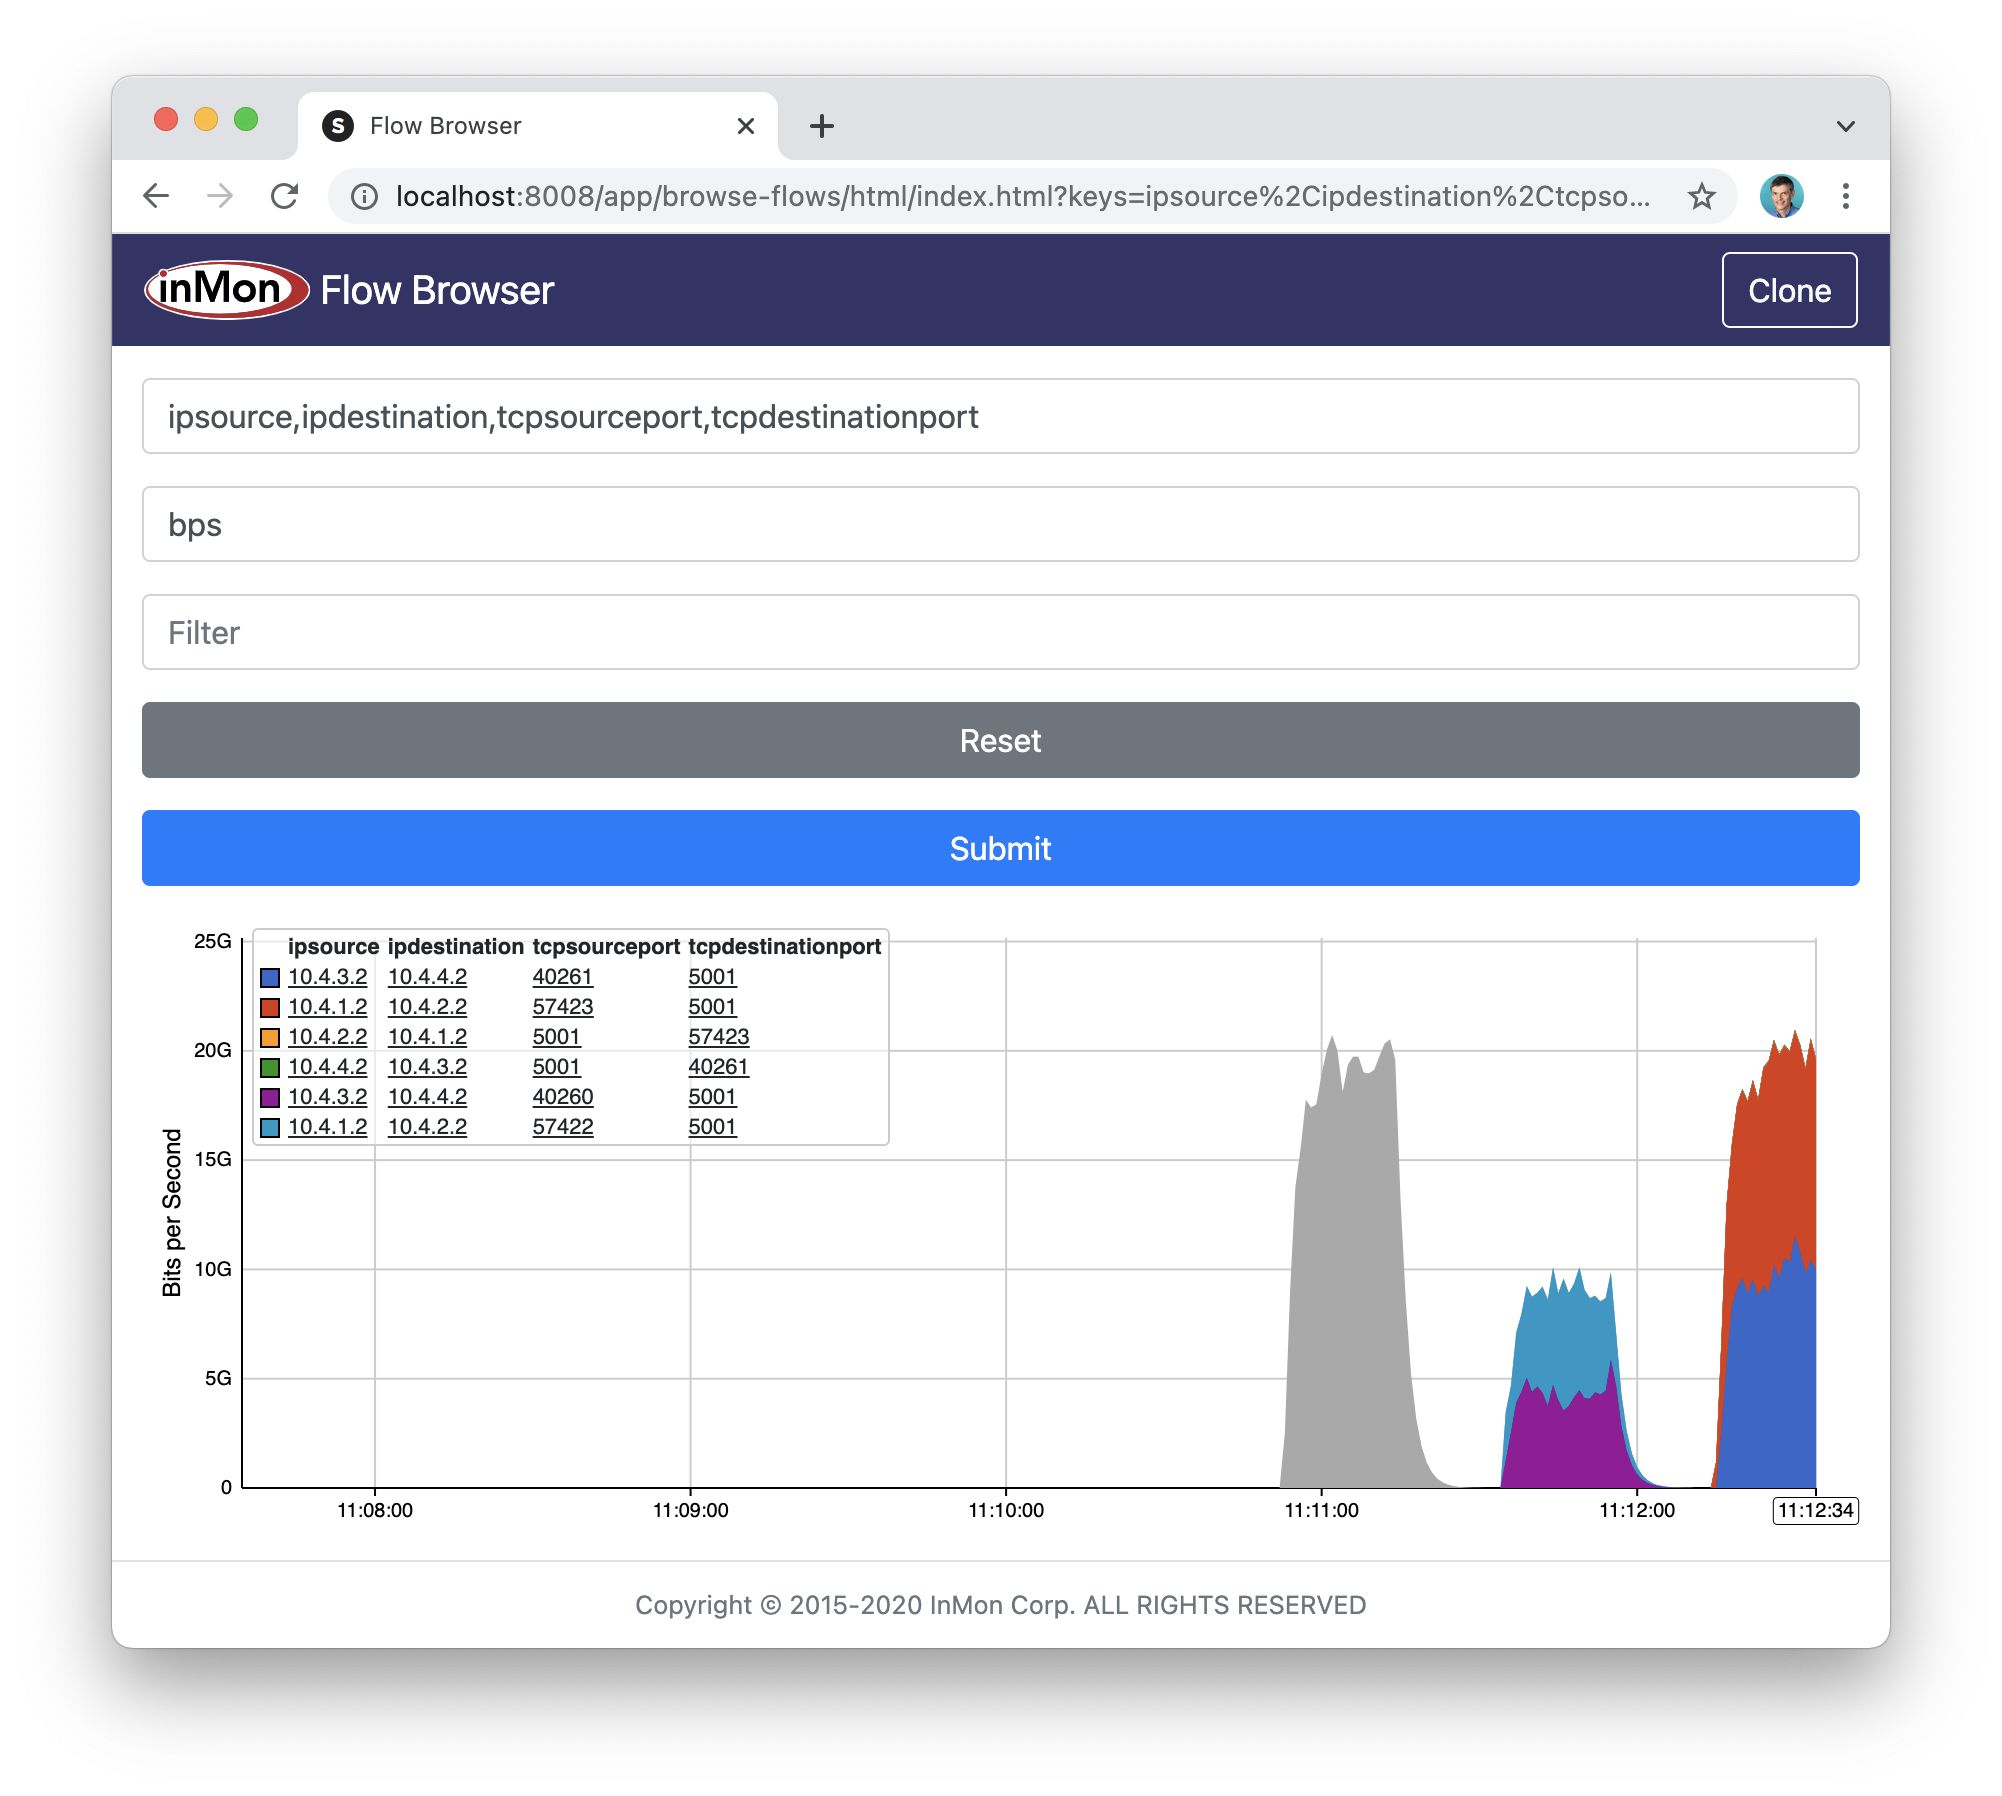
Click on the browse-flows button to open the application and trend traffic flows in real-time. Type Keys and a Value into the form and click Submit to start trending traffic. Click on peaks in the chart to see values at that time. Click on items in the chart legend to drill down by adding the item to the current Filter.
Defining Flows describes the flow analytics capability of sFlow-RT that can be explored using the browse-flows application.
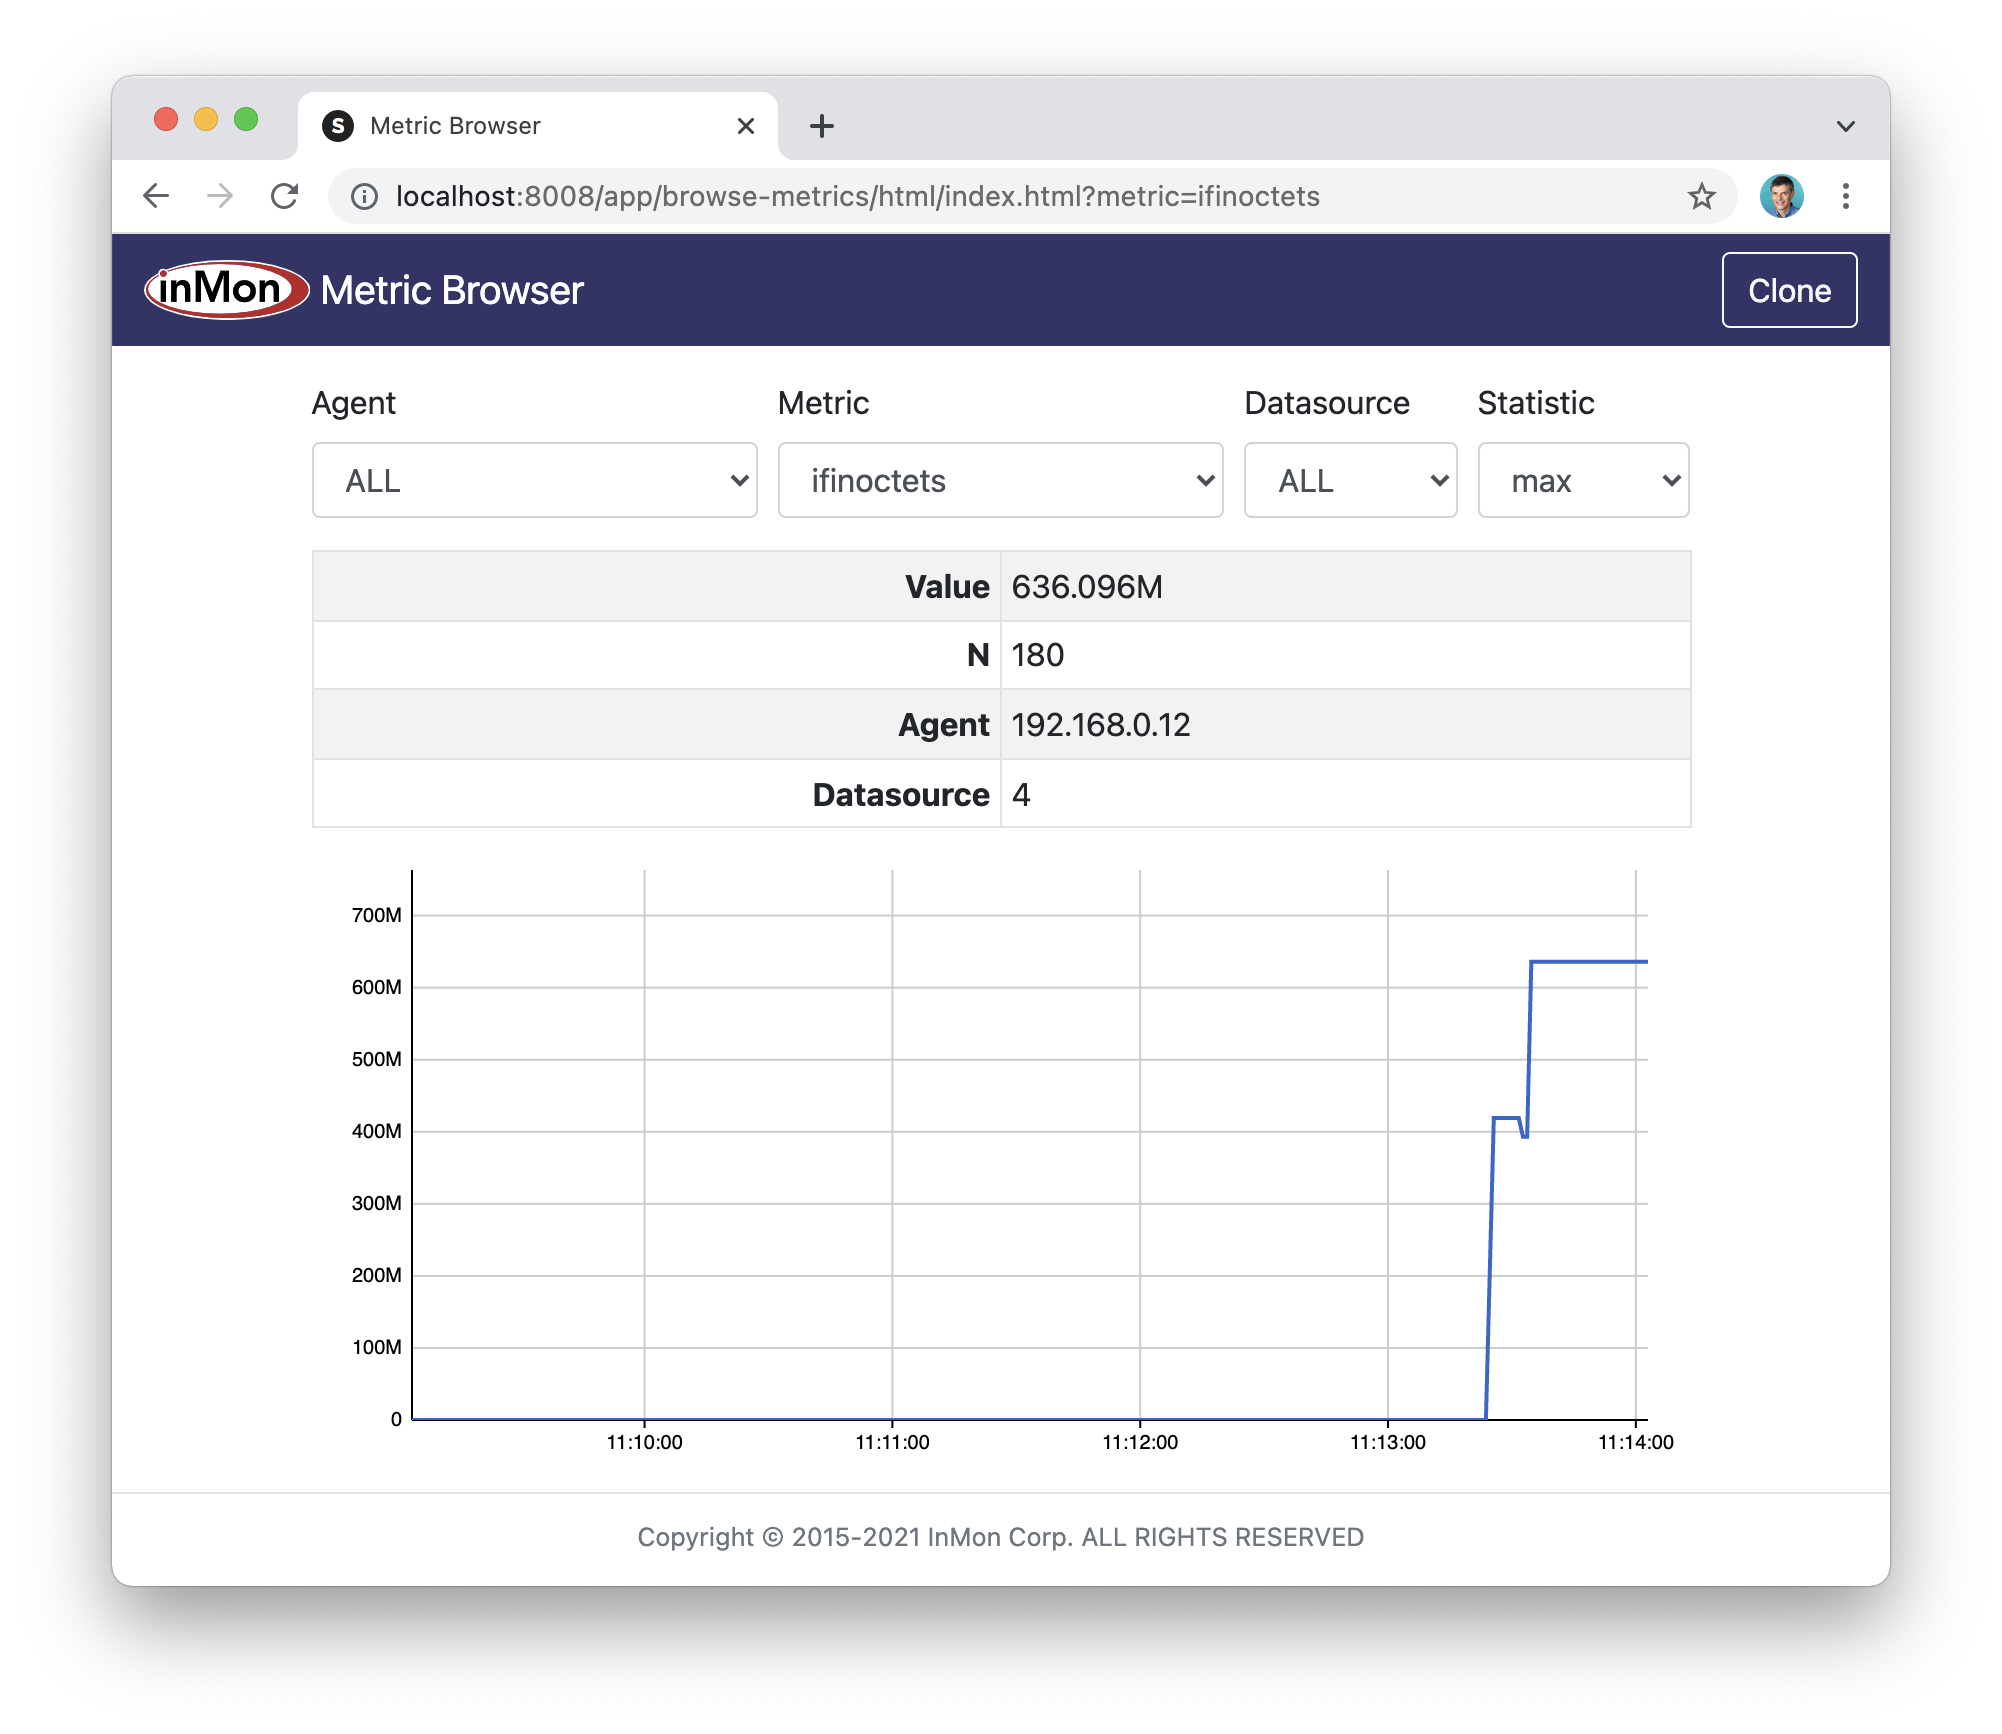
Use your browser back button to return to the Apps page and click on the browse-metrics button to open the application and trend metrics in real-time.
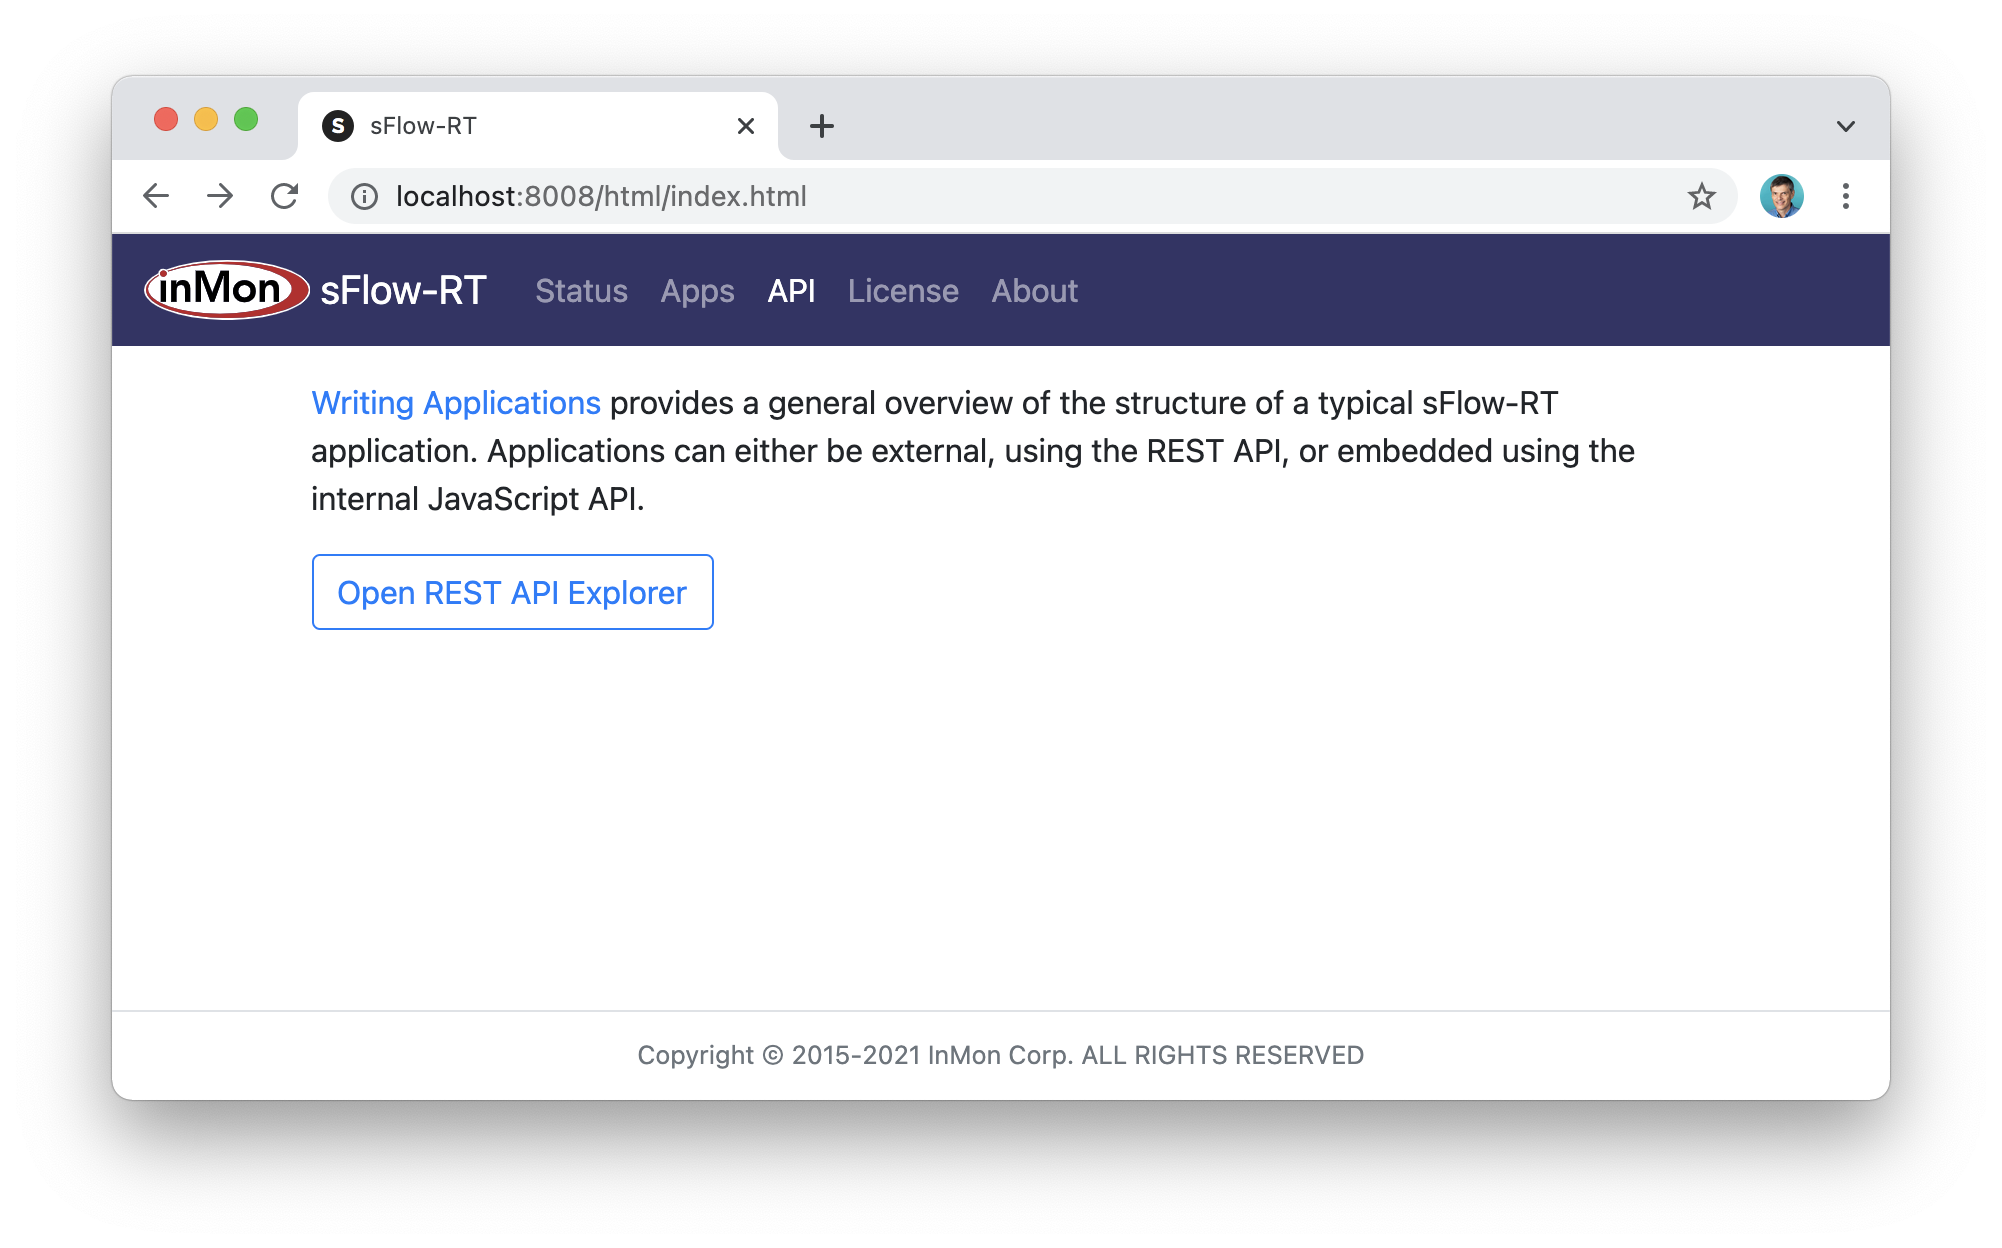
User your browser back button to return to the Apps page and select the API tab. The API tab provides a link to Writing Applications, an introductory article on programming sFlow-RT.
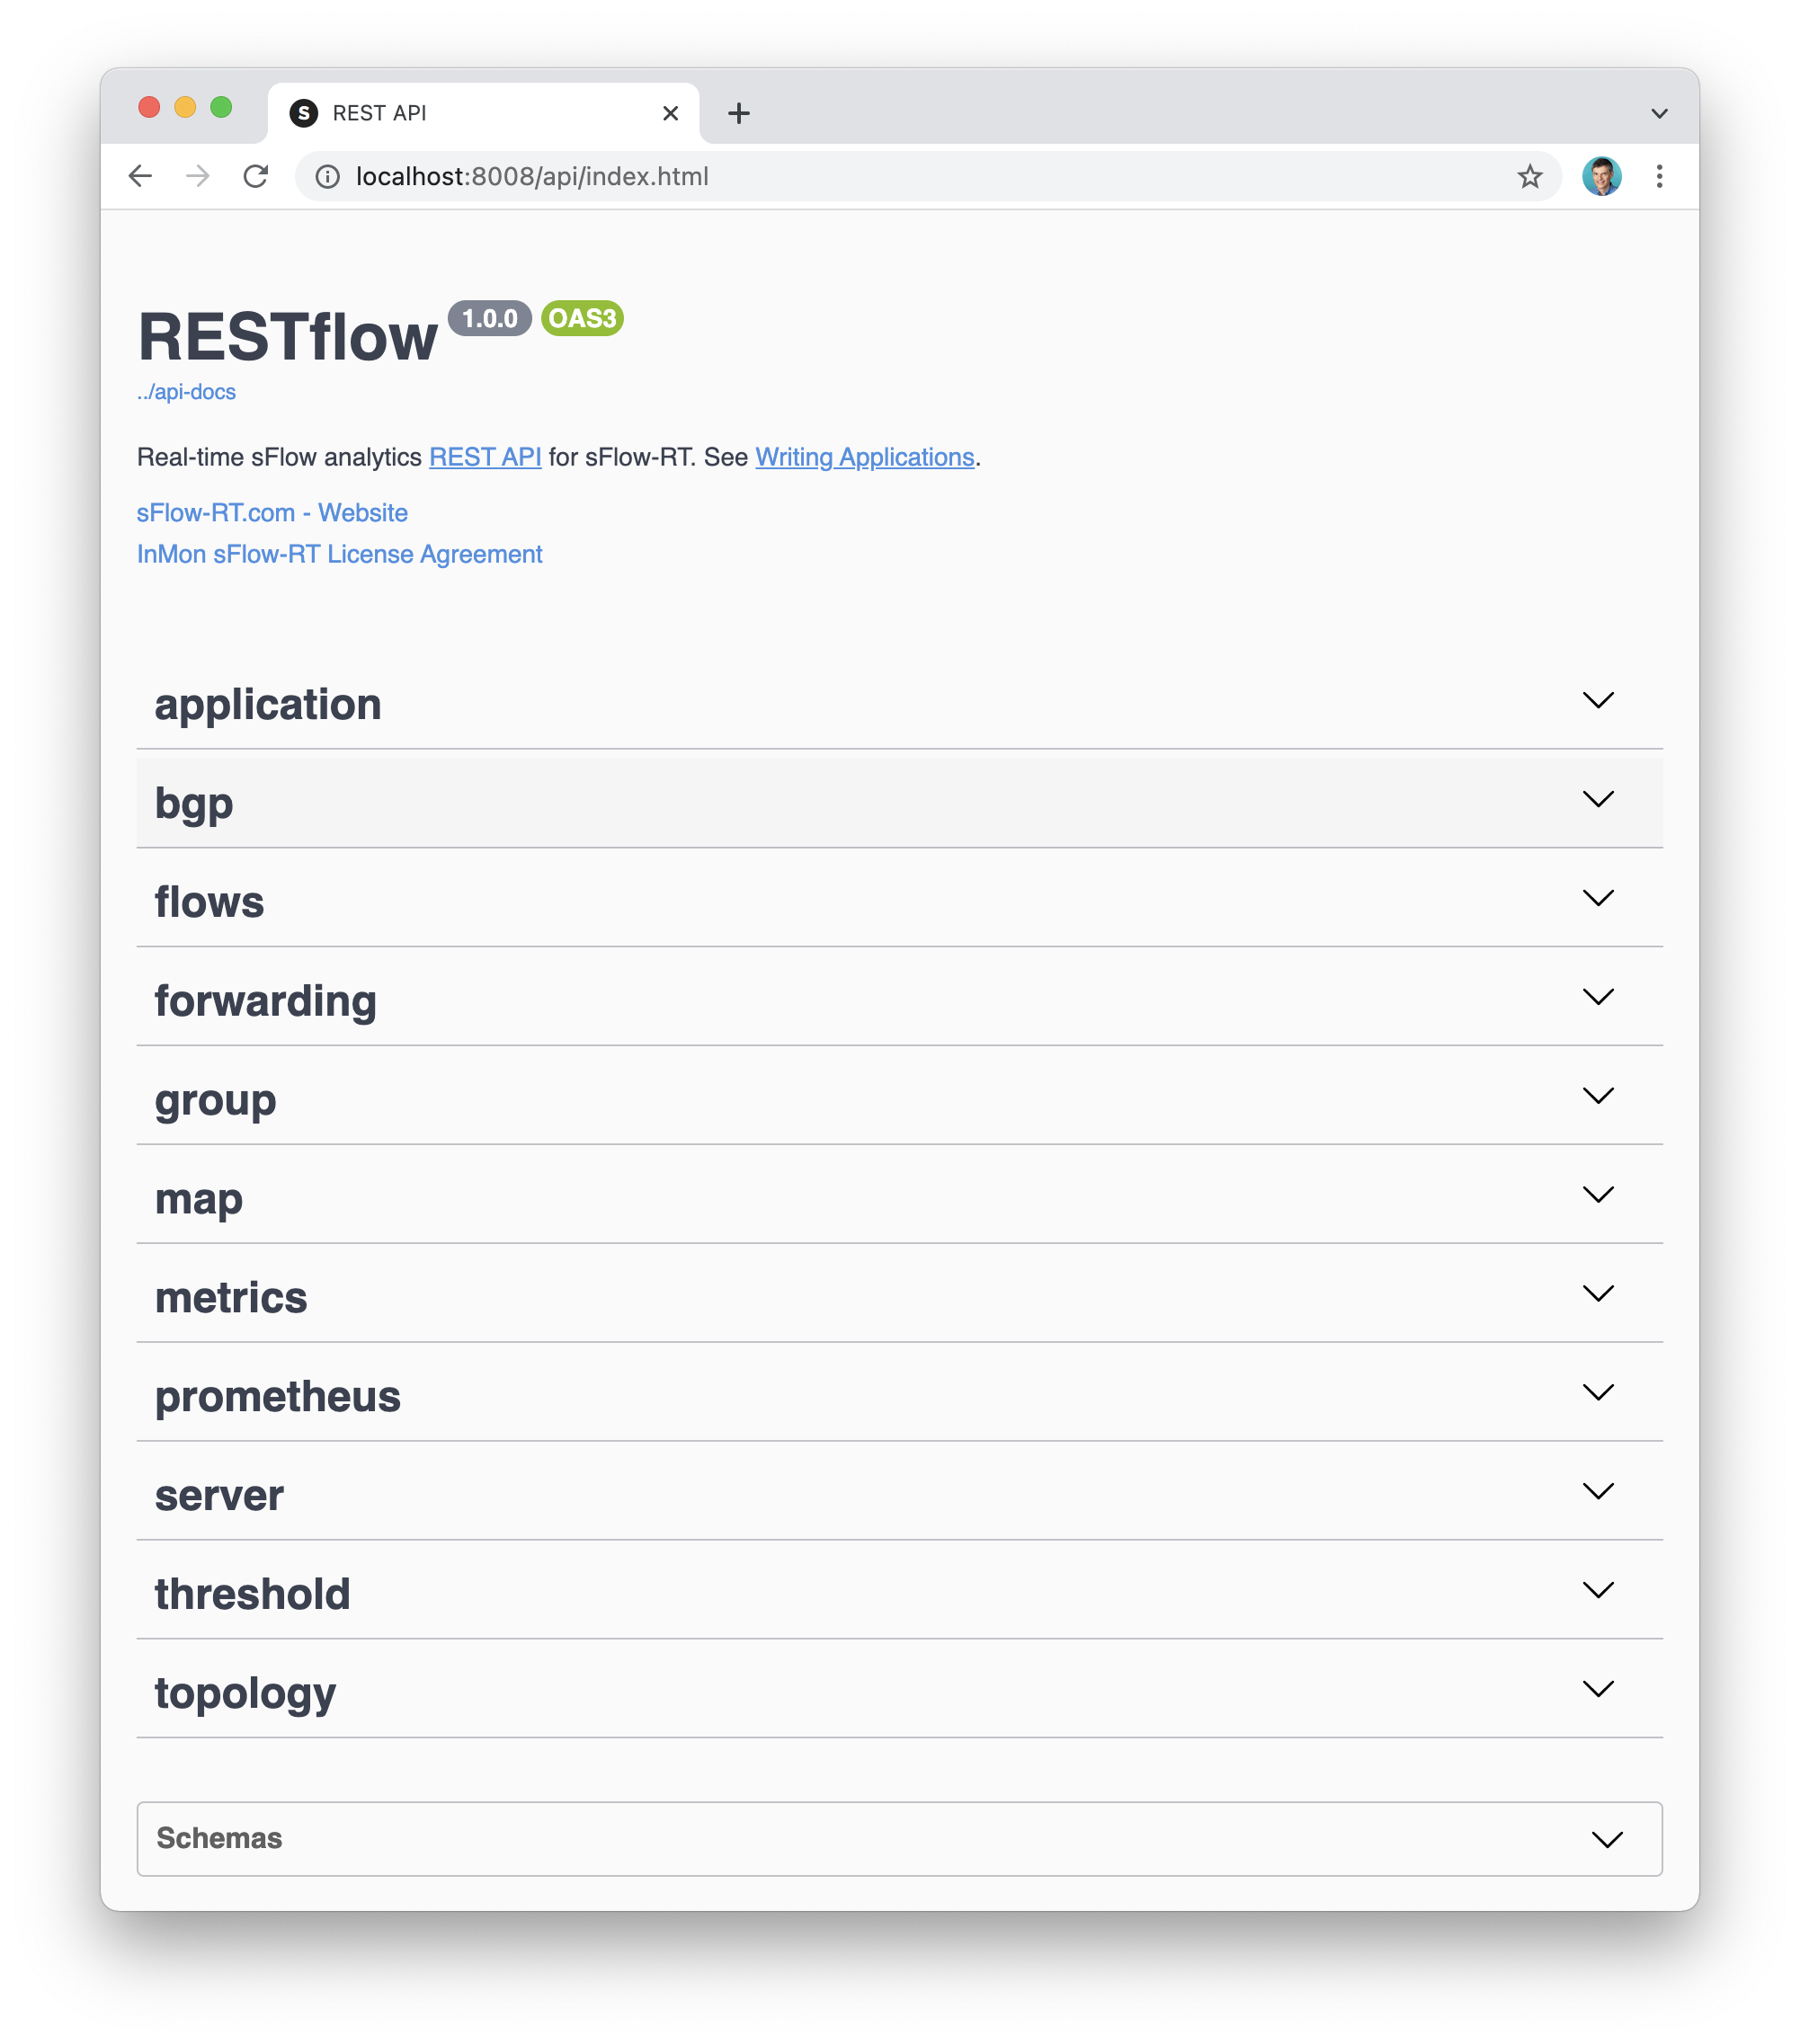
Clicking on the Open REST API Explorer button to access documentation on the sFlow-RT REST API and make queries.
Next Steps
There are a number of pre-built applications available for sFlow-RT. For example, DDoS protection quickstart guide describes how to use sFlow-RT to detect and mitigate DDoS attacks, AI Metrics with Prometheus and Grafana provides step by step instructions to monitor RoCEv2 traffic in a GPU cluster, Internet eXchange Provider (IXP) Metrics provides instructions for monitoring an IXP network, and Flow metrics with Prometheus and Grafana describes import flow data into a time series databases to support operational dashboards.
Writing Applications is a tutorial on building your own sFlow-RT applications. Additional documentation can be found on the sFlow-RT Reference page.
For additional help, visit the sFlow-RT Community page.
Admins
There are no access controls built into sFlow-RT. Follow Download and Install instructions to secure access using the host firewall and/or a reverse proxy.