Tuning Performance
The default sFlow-RT settings work for all but the largest networks. This article discusses how to monitor analytics engine performance and optimize configuration for large sites.
Follow the recommended Agent Settings. The recommended settings strike a balance for scalability and accuracy that works well for most environments. More aggressive settings are likely to reduce accuracy and scalability by increasing the likelihood that measurements will be lost during periods of heavy traffic.
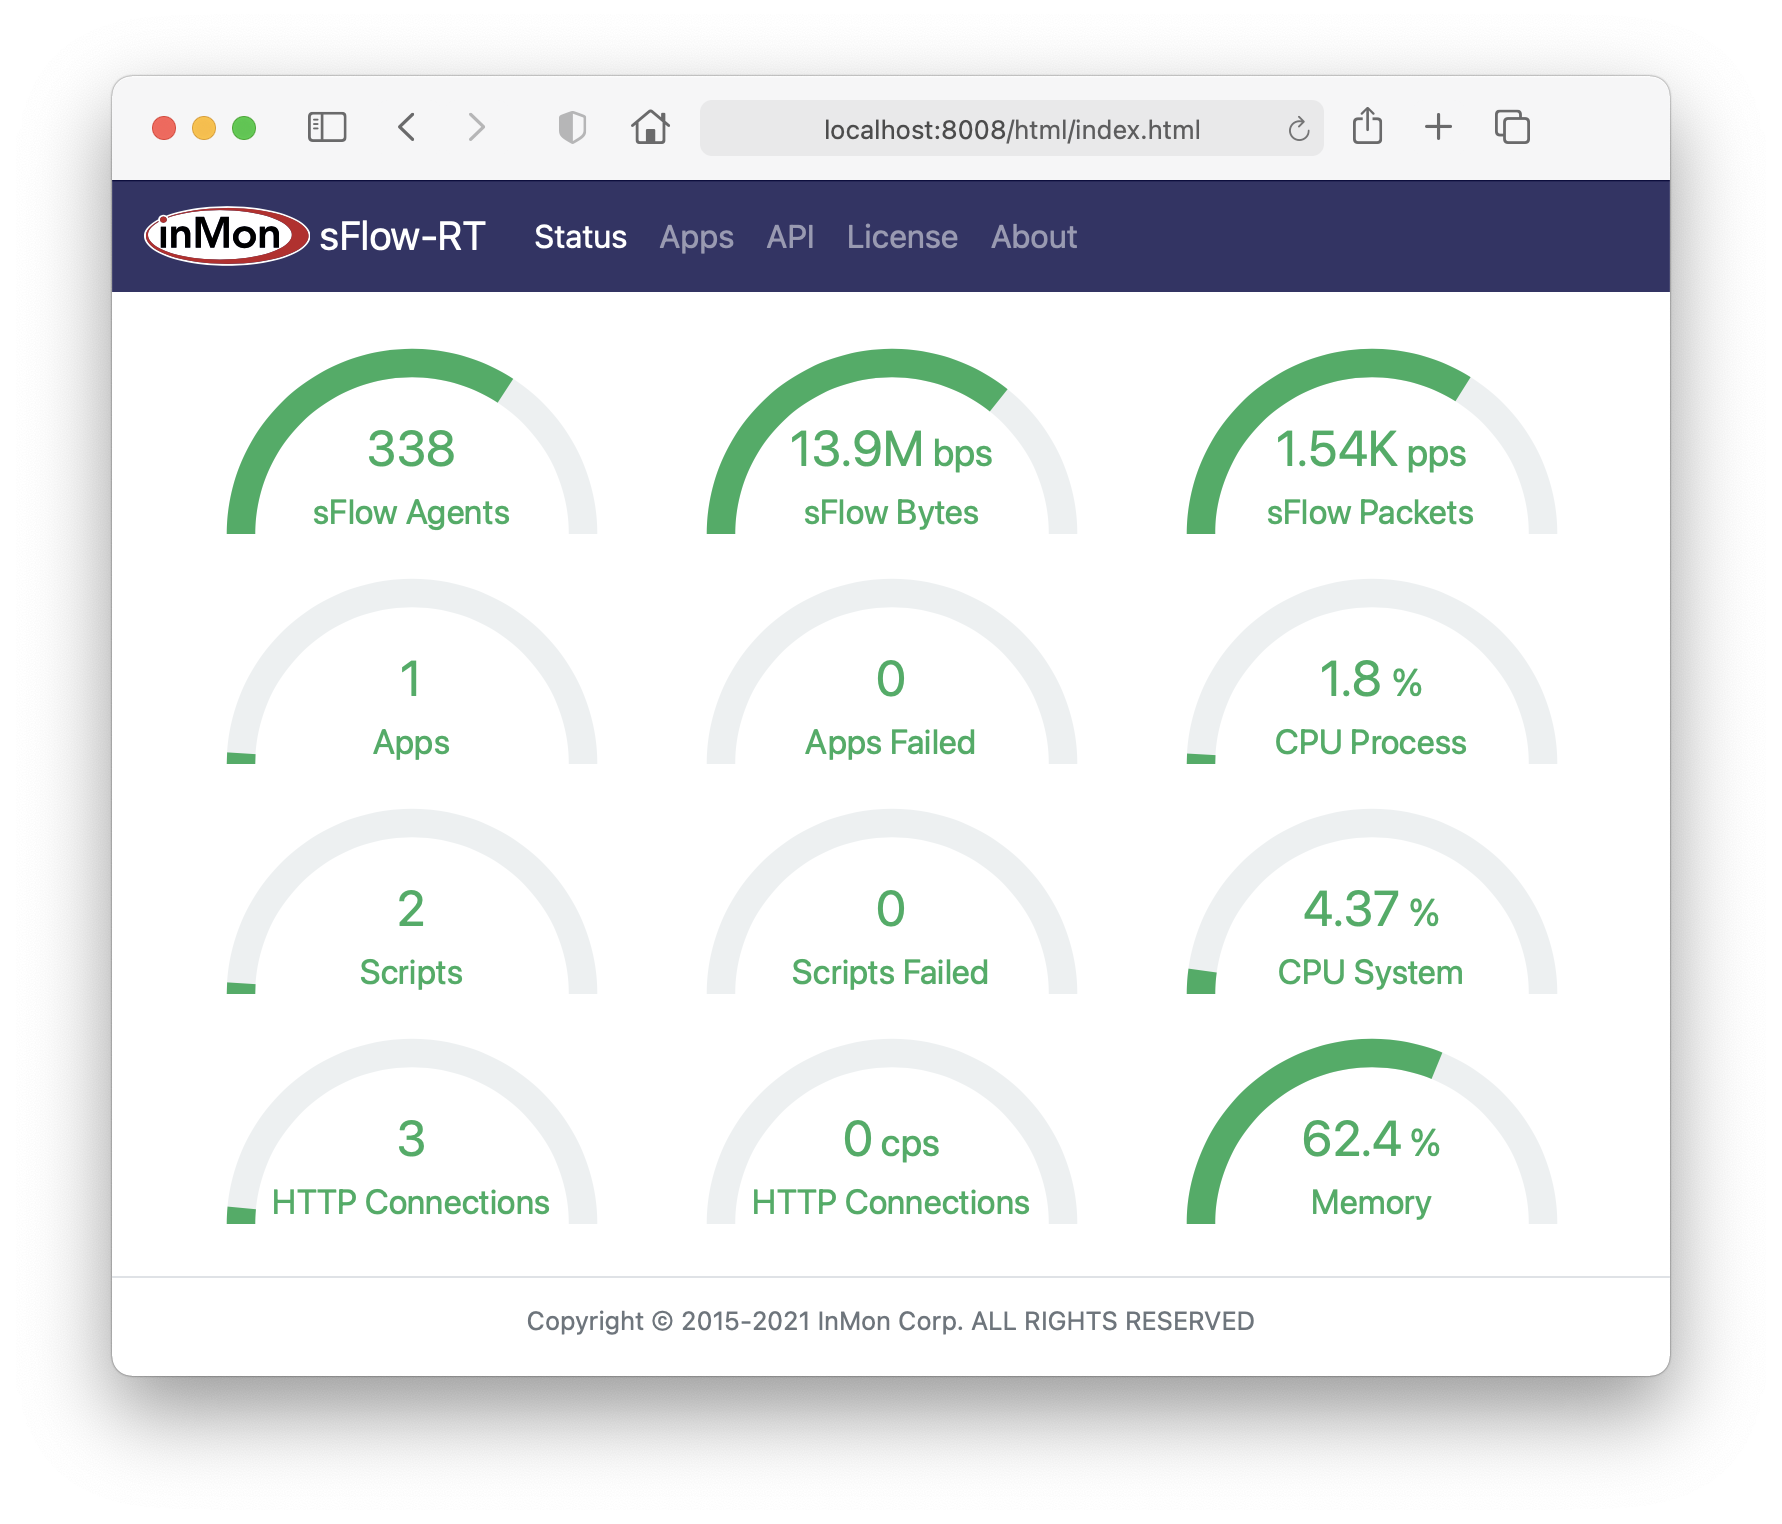
The sFlow-RT Status page shows key performance metrics:
- sFlow Agents, the number of switches/routers/hosts sending sFlow
- sFlow Bytes, the volume of sFlow telemetry being processed (bits per second)
- sFlow Packets, the number of datagrams being processed (packets per second)
- CPU Process, CPU utilization due to sFlow-RT and its embedded applications and scripts
- CPU System, CPU utilization on host running sFlow-RT
- Memory, Percent of sFlow-RT's allocated memory that is currently being used
- Apps, the number of running applications
- Apps Failed, the number of failed applications
- Scripts, the number of embedded scripts running
- Scripts Failed, the number of embedded scripts that failed
- HTTP Connections, the number of current HTTP connections to the REST API
- HTTP Connections (CPS), the rate of HTTP connections (connections per second)
The screen shot shows the dashboard from a site with 338 switches (with approximately 8,000 active switch ports). The Status page shows that all the metrics are within their normal ranges, indicating that the default settings are adequate. Grafana sFlow-RT Health Dashboard describes how to import the metrics into Prometheus and track them over time in a dashboard.
If the health metrics indicate that sFlow-RT reaching its performance limits, additional network, memory, and CPU resources can be allocated (up to the limits of the hardware).
Linux
If you are using iptables, open UDP port 6343 (sFlow) and disable connection tracking:
sudo iptables -I INPUT 1 -p udp --dport 6343 -j ACCEPT
sudo iptables -t raw -I PREROUTING 1 -p udp --dport 6343 -j NOTRACK
When sFlow-RT opens a UDP socket to receive sFlow datagrams it requests additional buffers. If the kernel limit on UDP buffers is smaller than the requested value there will be insufficient buffering to avoid sFlow datagram loss under heavy loads.
Use the following command increase the limit to at least 2048000, the default amount requested by sFlow-RT.
sudo sysctl -w net.core.rmem_max=2048000Note: The amount of buffer memory requested by sFlow-RT is controlled by setting
the sflow.rcvpktsbuffer property. If the value is increased from the default, make sure that the kernel
limit can accomodate the new value. Excessive buffering introduces delay in the measurements that will reduce the accuracy of
sFlow-RT's real-time analytics - keep the buffer depth to at most 100mS worth of data during peak loads.
Type the following command to report UDP statistics:
netstat -suThe Udp: receive buffer errors counter reports the dropped packet count. If packets are being dropped, consider increasing the amount of buffering and enabling SO_REUSEPORT.
Swapping activity can severely impact sFlow-RT performance, use the following setting to minimize swapping behavior.
sudo sysctl -w vm.swappiness=1Edit /etc/sysctl.conf to make both settings persist across reboots.
Memory
By default, sFlow-RT pre-allocates 1G and has an upper limit of 1G of memory. Under normal operation, memory utilization can vary anywhere between 20% and 80%. If the memory utilization stays in the 80% to 100% range, then the allocation should be increased. Don't over-allocate memory as this risks swapping behavior that can adversely affect sFlow-RT response times.
-Xms4G
-Xmx4G
Edit /usr/local/sflow-rt/conf.d/sflow-rt.jvm and apply the settings above to
increase the memory allocation to 4G.
docker run -e "RTMEM=4G" -p 8008:8008 -p 6343:6343/udp sflow/sflow-rtIf you are using the pre-built sflow/sflow-rt Docker image,
set the RTMEM variable.
CPU
By default, sFlow-RT pre-allocates 4 worker threads to decode the sFlow datagrams and update metrics. The sFlowDatagramsDiscarded
counter accessed through the /analyzer/json REST API indicates that a worker queue was full and a datagram was discarded. If a significant number of datagrams are being discarded,
additional worker threads can be started by setting the workers.number property, and additional datagrams can be
queued for each worker by increasing the workers.maxqueue property from the default value of 400.
Note: Don't add more worker threads than there are CPU cores. Also, don't add worker threads if either the CPU Process or CPU System are close to 100% since this indicates that the server is already at full capacity.
Java 25+
By default, sFlow-RT is configured for Java 17. Java 25+ provides a number of features that improve performance.
When using Java 25+,
edit /usr/local/sflow-rt/conf.d/sflow-rt.jvm and add the following line:
-XX:+UseCompactObjectHeadersThe full garbage collector settings should be as follows:
-XX:+UseZGC
-XX:+UseCompactObjectHeaders
-XX:+ExitOnOutOfMemoryError
Note: The pre-built sfow/sflow-rt Docker image includes Java 25 with these settings.
SO_REUSEPORT
The SO_REUSEPORT socket option is available on Linux distributions with a 3.9+ kernel.
The default is for sFlow-RT to use a single receiver thread to receive UDP datagrams and queue them for
the worker thread responsibe for updating metrics for the sending agent. The single thread should be
able to handle between 200,000 and 400,000 datagrams per second - depending on the host's performance.
If the datagram rate exceeds the single thread performance, additional receiver threads can be started by
setting the receivers.number property.
Note: Don't add more receiver threads than there are CPU cores. Also, don't add receiver threads if either the CPU Process or CPU System are close to 100% since this indicates that the server is already at full capacity.