Writing Applications
This tutorial provides a general overview of the structure of a typical sFlow-RT application. Applications can either be external, using the sFlow-RT REST API, or embedded using sFlow-RT's internal JavaScript API. This tutorial focuses on writing embedded applications. However, the overall structure of external and embedded applications is very similar and equivalent REST API calls are illustrated using Python.
Embedded applications have the following directory structure:
sflow-rt/app/my-app/html/index.html
sflow-rt/app/my-app/scripts/
When sFlow-RT is started, it will start a thread for each of the files with a .js extension in the scripts directory and will expose the html directory, if it exists, under the path:
http://localhost:8008/app/my-app/html/See Create HTML user interface for more information.
Information about running scripts can be found under the path:
http://localhost:8008/scripts/jsonStructured comments at the head of a script .js file can be used to add metadata, e.g.
// author: InMon
// version: 1.0
// date: July 12, 2017
// description: My test script
// copyright: Copyright (c) InMon Corp.
There are a large number of global functions defined in the JavaScript API. These global names
can be wrapped in their own name space to avoid overlap with functions defined in the script by adding a wrapglobals: comment, e.g.
// wrapglobals: rt
rt.logInfo("wrapped logInfo function");
The packaged versions of sFlow-RT make it easier to run the software in production. However, for development, running sFlow-RT at the command line makes it easier to start and stop the application and to see the log messages:
wget http://www.inmon.com/products/sFlow-RT/sflow-rt.tar.gz
tar -xvzf sflow-rt.tar.gz
./sflow-rt/start.sh
Alternatively, using pre-built sflow/sflow-rt Docker image:
docker run --rm -v $PWD/my-app:/sflow-rt/app/my-app -p 8008:8008 -p 6343:6343/udp sflow/sflow-rtScript errors are printed with an error description, filename and line number. Add logInfo() statements for debugging. In addition, JSON.stringify can be useful for showing the structure of objects, for example:
logInfo(JSON.stringify(request));Download applications to try out and modify existing code. The browse-metrics, browse-flows, and browse-drops applications are a useful way to explore metrics, traffic flows, and dropped packet notifications available from the sFlow telemetry stream. Real-time network and system metrics as a service and Topology describe how to use captured sFlow to experiment without access to a live network. The open source Mininet network emulator is an alternative, see Multipass, Mininet flow analytics, Mininet dashboard, and Ryu measurement based control. Finally, Containerlab includes a number of demonstrations, including sFlow-RT Development Environment, a set of examples based on this guide.
The published applications on the Downloads page provide examples that demonstrate this structure. Browse the files on GitHub to see how the applications are constructed.
Select a distinctive name for the application that doesn't clash with applications listed on the Downloads page. If you are planning to share the applications, create a project on GitHub using the application name as the repository name.
Applications typically implement a number of the following steps:
- Define flows
- Define thresholds
- Handle threshold events
- Handle flow records
- Handle periodic tasks
- Handle HTTP requests
- Create HTML user interface
Each of these steps is described below.
Define flows
Flows are used to match packets or transactions that share common attributes and compute rate information, for example the following JavaScript function defines a flow called tcp that captures the source and destination IP addresses and TCP ports and calculates bytes per second for each flow:
setFlow('tcp',
 { keys:'ipsource,ipdestination,tcpsourceport,tcpdestinationport',
  value:'bytes', log:true }
);
The following Python code defines the same flow using the REST API:
#!/usr/bin/env python3
import requests
import json

flow = {'keys':'ipsource,ipdestination,tcpsourceport,tcpdestinationport',
 'value':'bytes','log':True}
requests.put('http://localhost:8008/flow/tcp/json',data=json.dumps(flow))
The setting the log attribute to true causes sFlow-RT to log flow records, see Handle flow records. If the flag is omitted, or set to false, then no records will be created.
For more information, see Defining Flows.
Examples
Define thresholds
Thresholds are applied to Metric values. Defining flows create additional metrics and thresholds can be applied to generate a notification when the rate value associated with a flow exceeds the threshold.
The following JavaScript functions defines a threshold to detect tcp flows exceeding 1Mbit/s based on the flow definition above:
setThreshold('large-tcp',
 { metric:'tcp', value: 1000000 / 8, byFlow:true }
);
The byFlow flag indicates that a threshold event should be generated for each individual flow crossing
the threshold. If the flag is omitted, a single event will be generated for the largest flow.
The next example defines a pair of threshold that detects switch ports with a ingress / egress utilization exceeding 70% based on the ifinutilization and ifoututilization metrics.
setThreshold('inutilization', { metric:'ifinutilization', value: 70 });
setThreshold('oututilization', { metric:'ifoututilization', value:70 });
The following Python code defines the large-tcp threshold using the REST API:
#!/usr/bin/env python3
import requests
import json

threshold = {'metric':'tcp', 'value': 1000000/8, 'byFlow':True}
requests.put('http://localhost:8008/threshold/large-tcp/json',data=json.dumps(threshold))
Examples
Handle threshold events
Register an event handler function to be notified of each new event:
setEventHandler(function(evt) {
 logInfo(JSON.stringify(evt));
});
The above code converts the events to JSON and logs them. This is a useful way to see the contents of the event before deciding how they should be processed.
The following Python code uses the REST API to perform a similar function:
#!/usr/bin/env python3
import requests
import json

eventurl = 'http://localhost:8008/events/json?maxEvents=10&timeout=60'
eventID = -1
while 1 == 1:
  r = requests.get(eventurl + "&eventID=" + str(eventID))
  if r.status_code != 200: break
  events = r.json()
  if len(events) == 0: continue

  eventID = events[0]["eventID"]
  events.reverse()
  for e in events:
    print(json.dumps(e))
The REST API uses long-polling as a method of asynchronously pushing events to the client. The events HTTP request blocks until there are new events or a timeout occurs. The client immediately reconnects after receiving a response to wait for further events.
Note: There may be other applictions installed on sFlow-RT that have defined their own events. A list of
event names can be passed into the setEventHandler() call or provided as query arguments in the REST call to select
specific event streams (based on the threshold name).
Examples
- ddos-protect, see Event handler
- fabric-metrics, see Event handler
Handle flow records
Register a flow handler to be notified of each new flow:
setFlowHandler(function(flow) {
  logInfo(JSON.stringify(flow));
});
The above code converts flow records to JSON and logs them. This is a useful way to see the contents of the the flow before deciding how they should be processed.
The following Python code uses the REST API to perform a similar function:
#!/usr/bin/env python3
import requests
import json

flowurl = 'http://localhost:8008/flows/json?maxFlows=10&timeout=60'
flowID = -1
while 1 == 1:
  r = requests.get(flowurl + "&flowID=" + str(flowID))
  if r.status_code != 200: break
  flows = r.json()
  if len(flows) == 0: continue

  flowID = flows[0]["flowID"]
  flows.reverse()
  for f in flows:
    print(json.dumps(f))
The REST API uses long-polling as a method of asyncrhonously pushing flow records to the client. The flows HTTP request blocks until there are new flows or a timeout occurs. The client immediately reconnects after receiving a response to wait for further flows.
Note: There are a number of setting that can be applied when defining the flow that affect the flow records that are logged. The log flag was discussed in Define flows, additional flow logging options include: flowStart to log the beginning of flows and activeTimeout to periodically export records for long running flows - see Defining flows.
Examples
- ixp-metrics, see Flow handler
Handle periodic tasks
Register an interval handler to run periodic tasks:
setIntervalHandler(function() {
 var r1 = metric('ALL','avg:load_one',{'host_name':['*.myco.com']});
 var r2 = dump('ALL','host_name;load_one',{'host_name':['*.myco.com']});
 var r3 = table('ALL,'host_name,sort:load_one:-10',{'host_name':['*.myco.com']});
 var r4 = activeFlows('ALL','tcp',10);
 // log results r1,r2,r3,r4
}, 10);
The above code runs every 10 seconds and uses
JavaScript API functions metric(), dump(), table() and activeFlows() to retrieve
metric and flow data.
REST API clients will have their own polling loop or can be scheduled to run periodically using cron. REST API calls to retrieve metrics include, /metric, /dump, /table and /activeflows. The following
Python code performs equivalent functions:
#!/usr/bin/env python3
import requests
import json

url='http://localhost:8008'
r1=requests.get(url+'/metric/ALL/avg:load_one/json?host_name=*.myco.com')
r2=requests.get(url+'/dump/ALL/host_name;load_one/json?host_name=*.myco.com')
r3=requests.get(url+'/table/ALL/host_name,sort:load_one:-10/json?host_name=*.myco.com')
r4=requests.get(url+'/activeflows/ALL/tcp/json?maxFlows=10')
# log results r1,r2,r3,r4
Queries model metrics as a logical table:
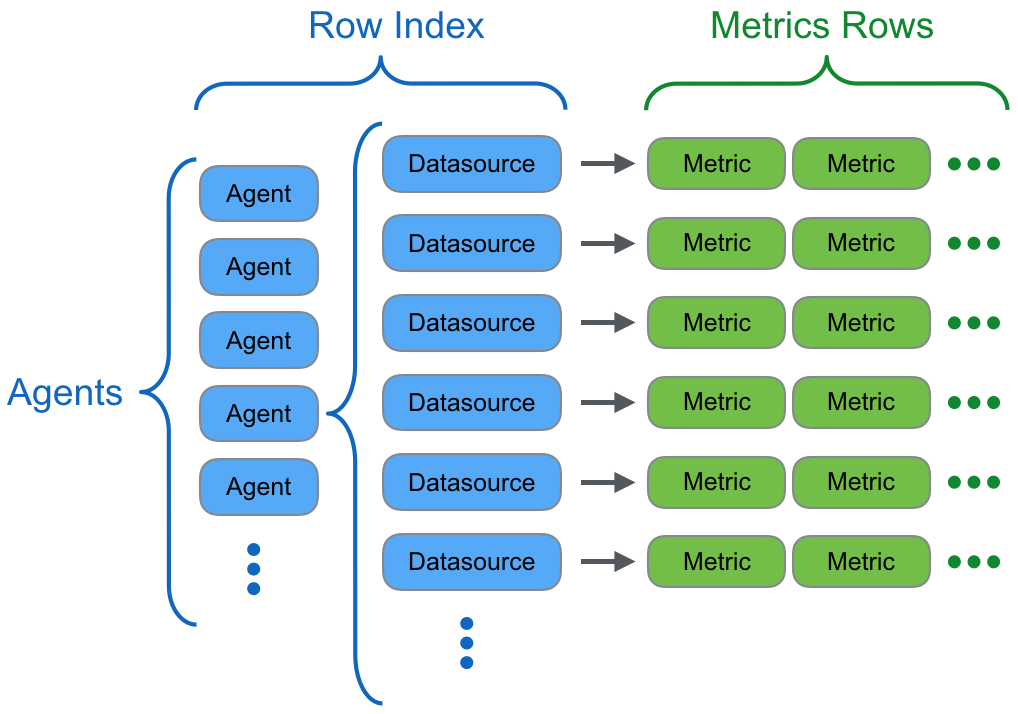
An Agent is a network device or host sending metrics and is identified by its IP address. Datasources within each Agent periodically export a set of metrics. Datasources can be network interfaces, hosts, virtual machine, applications instances, etc. and metric sets vary between different data sources witin an agent. The combination of an Agent and a Datasource references a set of metrics.
In the above examples, the ALL token expands to a list of all agents. Agents can be explicity listed as a comma delimited list of agent addresses.
The metric query walks the table and returns a value that summarizes each of the metrics in a comma separated list of metrics - results are returned in the same order as the list of metric names in the query. By default, the maximum value of each metric (and the Agent and Datasource reporting the metric) are returned. The statistic can be modified by prefixing the metric name with an aggregation type followed by a colon, in this example avg: specifies that the average value is required. A filter can be used to match metric values in each row. In the examples, the filter limits the queries to rows in which the host_name metric matches the pattern *.myco.com.
The table query doesn't summarize metrics. Instead, the query returns rows from the logical table that include the metrics specified in the query. The sort: prefix can be used to indicate a metric value that will be used to sort the result table (the :-10 suffix indicates that at most 10 values should be returned. The negative sign indicates a reverse sort, i.e. return the largest 10 values). The dump query is similar, but instead of walking the table row by row, individual metrics are traversed in their internal order.
Printing out the results of queries as JSON encoded strings, or executing queries in a browsers using the REST API, is a good way to experiment with queries and see the details returned in the responses.
Examples
Handle HTTP requests
Register an HTTP handler to build a custom REST API for the application:
setHttpHandler(function(request) {
  return request;
});
The above code returns the request object as the response. This is a useful way of seeing how fields are encoded in the request object before deciding how to respond. GET, PUT, POST, and DELETE and delete operations are supported for JSON encoded request bodies.
The script's REST API has the following path:
http://localhost:8008/app/my-app/scripts/script.js/jsonNote: The URL can included an extended sub-path and query parameters, provided that the path always ends in /json, e.g.
http://localhost:8008/app/my-app/scripts/script.js/a/b/json?q1=v1&q2=v2The REST API can be document using the OpenAPI specification. Add an api.yml file containing the specification to the application home directory:
sflow-rt/app/my-app/api.ymlAn interactive API explorer will be available under the URL:
http://localhost:8008/app/my-app/api/Examples
Create HTML user interface
Files in the application html sub-directory are served as web content. Client side html, css, image and javascript files are used to construct the web interface. Any HTML5 framework can be used. The web user interface interacts with the application by making AJAX calls to the application's HTTP handler, see Handle HTTP requests. The relative path for an AJAX request to an application script is:
../scripts/script.js/jsonAn external application can host contents directly under a web server using a CGI interface and interact with sFlow-RT via its REST API. Hybrid approaches are also possible, using server side scripts to build an application specific set of functions that are in turn exposed through a remote web interface.
Use browser developer tools to debug formatting and scripting errors in the user interface. Add console.log statements to client-side JavaScript to log debug information to the browser console.
Applications don't need to have a user interface. For example, if the application sends metrics to a time series database or an event logging system then the user interface for the downstream tools is likely to be the primary method of interacting with the data.
If a REST API is the primary method of interacting with the application then Handle HTTP requests describes how to document the API and add an interactive REST API explorer.
Examples
- dashboard-example, see HTML and HTTP request handler